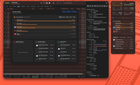
Problem: The built-in Activity Monitor is solid, but once you need deeper insights or faster workflows, it quickly becomes limiting. ProcessSpy is designed to give power users richer data and more control without dropping into Terminal.
Comparison: ProcessSpy vs. Activity Monitor: Compared to Activity Monitor, the free version of ProcessSpy includes:
- Menu bar popover
- Triage dashboard
- More detailed process information such as Version, Command Line, Start Time, listening ports, and signing details.
- More detailed resource metrics: CPU user/system ratio, CPU QoS, Memory Footprint with Peak Footprint, Page-ins and disk read/write including per second metrics
- Per-process network, GPU and disk I/O
- Advanced filtering powered by JavaScript.
- Fast multi-property and regex search.
- Hierarchy view with aggregated metrics (CPU, Resident Memory, Threads).
- Mini CPU graph for each process.
- Timeline view for each process
- Point-and-click process discovery.
- Pause/Resume and signal handling directly from the context menu.
- Reveal processes and their open files in Finder.
- Export visible processes to JSON.
(Additional capabilities are available in the paid tier—see the homepage for full details)
Pricing: Freemium. Download the fully functional free version here: https://process-spy.app and use it without limitations. Premium features can be unlocked with a one-time purchase ($34.99 lifetime updates, unlimited devices).
ProcessSpy is also available on Setapp for the same price with one-year subscription option ($14.99). The one-year subscription is only available through Setapp.
What's New:
Network monitoring:
- Global and per-process network stats — see exactly which process is using your bandwidth.
- Listening ports exposed in the main table, menu bar popover, quick-search and JS filters.
- New JS properties:
listeningPorts,downloadBytesPerSecond,uploadBytesPerSecond,totalDownloadedBytes,totalUploadedBytes.
Per-process GPU and disk:
- GPU usage and disk read/write broken down per process, not just system-wide.
Process triage dashboard:
- A quick overview of what's actually stressing your Mac right now, available both in the main window and in the menu bar popover.
Alerts:
- Alerts for GPU, disk and network activity.
- Lingering alerts, so you don't miss a spike that happened while you were away.
System process visibility:
- A privileged helper tool now provides full information for system processes that were previously opaque.
Automation and menu bar:
- Automatically start recording for any process matching a JS expression.
- Default menu bar properties and sorting per filter, plus inline properties in the menu bar process list.
- More signals available directly from the process context menu.
Plus the usual round of fixes and performance improvements.
Localization note: If you'd like to help translate ProcessSpy into your language, feel free to DM me. Native speakers familiar with technical terminology are especially welcome. I'll gladly offer a lifetime license to contributors who complete a full translation.
Happy monitoring!
https://www.reddit.com/gallery/1wfxx4r
Source: r/macapps · by /u/OneDevoper