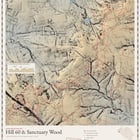
Part 2 of 6 in a series on Belgium's Great War, made from the open LiDAR terrain model of Flanders.
Data
– Terrain: Digitaal Hoogtemodel Vlaanderen II, 1 m DTM (airborne LiDAR) © Digitaal Vlaanderen- Trenches: British trench map "Zillebeke" 28 NW4 & NE3, ed. 3D, trenches corrected to 22 June 1916 (public-domain scan, Passchendaele Society 1917 collection on Wikimedia Commons)
– Source map, so you can compare: https://commons.wikimedia.org/wiki/File:DIG_MZ_08729_001.jpg
– Site names, craters, cemeteries: OpenStreetMap contributors (ODbL)
– Water: Overture Maps Foundation / OpenStreetMap

Method
– Multi-directional hillshade, plus a local relief model: the terrain minus its own 25 m average. That subtraction is what makes small hollows such as craters, trenches and shell holes stand out.
– I georeferenced the trench map against road junctions that still exist; 12 checkpoints agree within about 10 m, which is about as good as the 1916 map itself.
– German trenches are traced from the red ink; the British front line from the long blue dashes.
– The inset is a cross-section A–B from the terrain model: the Caterpillar crater (now a pond), the railway cutting the spoil came from, and the cratered ground of Hill 60, heights ×6.
– Height tint, and water from vector data. Made in Python (numpy, matplotlib, shapely), with the code written with an AI coding assistant; no AI generated imagery.
Caveats
– Faint "disused" trenches are left out. On the British side only the front line is shown: British trench maps left their own support trenches off, for security.
– Feature names and positions come from OpenStreetMap.
– The relief is from the 2013–2015 survey of Flanders.
Happy to answer questions about how it was made.
https://www.reddit.com/gallery/1xccux9
Source: r/MapPorn · by /u/FgnZ_DeBroin